The profit you keep, not the profit you quote.
Trade Goal plots a stock position as a trajectory and takes real margin interest out of the answer while you type. Most calculators quote the gross and stop there.
iPhone · iOS 17 or later · Not on the App Store yet
The dashed rule is break-even. Without borrowing it sits exactly on the $150.00 cost basis; the interest moves it to $151.66.
- Gross profit
- $5,000.00
- Borrow cost · 13.5% APR, 30 days
- −$166.44
32.2% return
The app, on a phone screen.
Every frame below is a real capture from the build: not a mockup, not a redraw. Pick a screen, throw a control, and the phone shows you exactly what the app shows. Nothing else on this page moves.
The free tier starts empty every launch. You are usually asking about a different stock than last time, so a blank scratchpad is the honest default rather than a limitation.
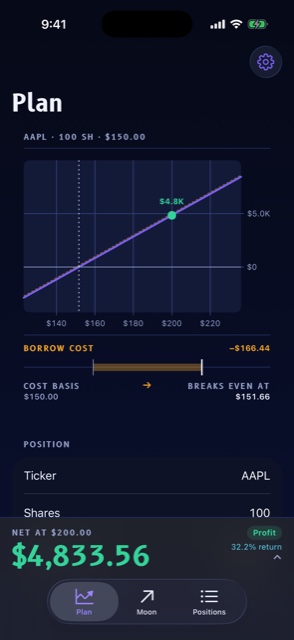
iPhone 17 Pro · captured from the build
One example position, typed in by hand. The app never fetches a price.
Borrowing moved your finish line. You should be able to see it.
$15,000 borrowed at 13.5% APR for 30 days costs $166.44. That is not a rounding error and it is not a footnote — it is the difference between the number you were quoted and the number you keep. Trade Goal deducts it from the headline figure and moves break-even to match.
On the trajectory above, the cost is about a pixel tall. So it gets its own magnified register instead of a line nobody can read.
Break-even at $150.00
Break-even at $151.66
One position, asked three ways.
The same 100 shares of AAPL at $150.00, held 30 days on margin. Every figure below is what the app returns for it.
If it hits $200, what do I actually walk away with?
$4,833.5632.2% return, after $166.44 of interest.
I want $10,000 in my pocket. What price gets me there?
$251.66A 67.8% move. Solved after borrow cost, so the profit you asked for is the profit you keep.
And if it did something completely unreasonable?
$360K 25×
$3,750.00 a share. Hypothetical, and labelled that way on the screen too.
How to read the instrument.
Every colour in the app has exactly one job, and nothing borrows a colour because it looked right. Once you know the six, you can read any screen above without a legend.
Colour is never the only signal. The docked figure always carries a word beside it (Profit, Loss, Flat, or Waiting), so the state is legible without it.
What it will never do.
These are not features that have not shipped yet. They are decisions, and they are the reason the app can be trusted with a number.
Every number comes from figures you type in. There is no networking code for quotes and none is planned, which keeps the app out of advice and market-data territory, and means it works on a plane.
Considered and rejected. Programmatic finance inventory rendered beside your projected profit reads as an endorsement, in an app whose entire position is arithmetic rather than advice.
No sign-up, no email, no analytics wall between you and the calculator. Open it and start typing.
No advice, no recommendations, no predictions. It does arithmetic on numbers you supply, and it says so on first launch.
Pro is where a ticker gets a name.
Free is a complete calculator for one position, re-entered each launch. Pro is a different tool, not the same tool unlocked: it remembers.
- The position book. A campaign per ticker, with a manual log of every buy and sell, so progress comes from what you actually executed.
- The trade path. A compounding plan from a stake to a goal — including what a single losing trade costs the rest of the chain.
- Bought once, kept. A lifetime unlock with restore. No renewal, no trial clock, nothing to cancel.
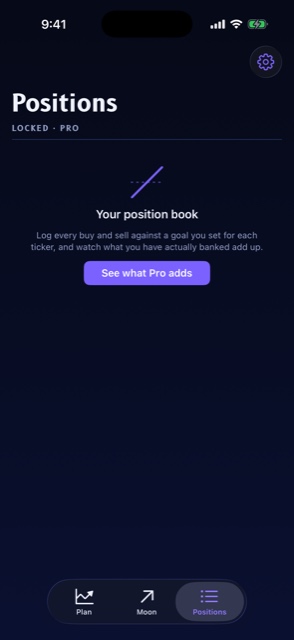
Free shows you the door, and says what is behind it.